

Roger Warburton: An affordable plan to reach net-zero greenhouse-gas emissions

The shore of Easton’s Point, in Newport. The neighborhood is very vulnerable to flooding associated with global warming.
— Photo by Swampyank
From ecoRI. org
NEWPORT, R.I.
It has been known for sometime that a reduction in greenhouse gases would have significant public-health benefits: less pollution means fewer deaths, fewer emergency room visits, and a better quality of life.
It’s also well known that reducing greenhouse gases would decrease the financial damages from hurricanes and storms, from droughts, and from coastal flooding.
The question, until now, has been: How do we pay for the necessary infrastructure changes?
A recent Princeton University study, Net-Zero America, presents a practical and affordable plan for the United States to reach net-zero greenhouse-gas emissions by 2050.
Although it’s a massive effort, the plan is affordable because it only demands expenditures comparable to the country’s historical spending on energy.
“We have to immediately shift investments toward new clean infrastructure instead of existing systems,” according to Jesse Jenkins, one of the project’s leaders.
The plan is also practical, because it uses existing technology. No magic tricks are required.
The plan is also remarkably detailed with analyses at the state and, sometimes, at the county level. For example, the report includes an estimate of the increase in jobs in Rhode Island if the plan were to be implemented.
In nearly all states, job losses in the fossil-fuel industry are more than offset by an increase in construction and manufacturing in the renewable-energy sector.
The motivation behind the recent study is clear: Climate change is “the most dangerous of threats” because it “puts at risk practically every aspect of our material well-being — our safety, our security, our health, our food supply, and our economic prosperity (or, for the poor among us, the prospects for becoming prosperous).”
The challenges are not underestimated: the burning coal, oil, and natural gas supply 80 percent of our energy needs and more than 60 percent of our electricity. Their greenhouse-gas emissions can’t be easily reduced or inexpensively captured and sequestered away.
The plan
The Net Zero America study details the actions required to achieve net-zero emissions of greenhouse gases by 2050. That goal is essential to avert the costly damages from the climate crisis.
The study highlighted six pillars needed to support the transition to net-zero:
End-use energy efficiency and electrification/consumer energy investment and use behaviors change (300 million personal electric vehicles and 130 million residences with heat pump heating).
Cleaner electricity (wind and solar generation and transmission, nuclear, electric boilers and direct air capture).
Bioenergy and other zero-carbon fuels and feedstocks (hundreds of new conversion facilities and 620 million t/y biomass feedstock).
Carbon dioxide capture, utilization, and storage (geologic storage of 0.9 to 1.7 giga tons CO2 annually and capture at some 1,000 facilities).
Reduced non-CO2 emissions: (methane, nitrous oxide, and fluorocarbons).
Enhanced land sinks (forest management and agricultural practices).
One of the study’s key findings is that in the 2020s all scenarios create about 500,000 to 1 million new energy jobs across the country. There are net job increases in nearly every state.
The pathways
The plan outlines five distinct technological pathways that all achieve the 2050 goal of net-zero emissions.
The authors don’t conclude which of the pathways is “best,” but present multiple, affordable options. All pathways only require investment and spending on energy in line with historical U.S. expenditures; around 4 percent to 6 percent of gross domestic product (GDP). The five pathways are:
High electrification: Aggressively electrifying buildings and transportation, so that 100 percent of cars are electric by 2050.
Less high electrification: This scenario electrifies at a slower rate and uses more liquid and gaseous fuels for longer.
More biomass: This allows much more biomass to be used in the energy system, which would require converting some land currently used for food agriculture to grow energy crops.
All renewables: This is the most technologically restrictive scenario. It assumes no new nuclear plants would be built, disallows below-ground storage of carbon dioxide, and eliminates all fossil-fuel use by 2050. It relies instead on massive and rapid deployment of wind and solar and greater production of hydrogen.
Limited renewables: This constrains the annual construction of wind turbines and solar power plants to be no faster than the fastest rates achieved in the United States in the past but removes other restrictions. This scenario depends more heavily on the expansion of power plants with carbon capture and nuclear power.
In all five scenarios, the researchers found major health and economic benefits. For example, reducing exposure to fine particulate matter avoids 100,000 premature deaths, which is equivalent to nearly $1 trillion in air pollution benefits, by midcentury compared to the “business-as-usual” pathway.
Wind and solar power, along with the electrification of buildings — by adding heat pumps for water and space heating — and cars, must grow rapidly this decade for the nation to be on a net-zero trajectory, according to the study. The 2020s must also be used to continue to develop technologies, such as those that capture carbon at natural-gas or cement plants and those that split water to produce hydrogen.
“The current power grid took 150 years to build. To get to net-zero emissions by 2050, we have to build that amount of transmission again in the next 15 years and then build that much more again in the 15 years after that. It’s a huge change,” according to Jenkins.
Roger Warburton, Ph.D., is a Newport, R.I., resident. He can be reached at rdh.warburton@gmail.com.
References: Net-Zero American, E. Larson, C. Greig, J. Jenkins, E. Mayfield, A. Pascale, C. Zhang, J. Drossman, R. Williams, S. Pacala, R. Socolow, EJ Baik, R. Birdsey, R. Duke, R. Jones, B. Haley, E. Leslie, K. Paustian, and A. Swan, Net-Zero America: Potential Pathways, Infrastructure, and Impacts, interim report, Princeton University, Princeton, N.J., Dec. 15, 2020.

Roger Warburton: Nov. was the warmest Nov. yet recorded

From ecoRI News (ecori.org)
Stop me if you’ve heard this story before: Last month was the warmest ever.
The latest global temperature data show that November 2020 was the warmest November ever recorded. The above figure shows the overall trend in global temperatures since 1880.
The red line for 2020 shows that average temperature for November was significantly above that of previous years. The significant rise in November’s temperature makes it very likely that 2020 will be the warmest year on record.
The figure below shows the average global November temperatures since 1880. The rise in November temperatures is quite substantial. The figure also shows that recent November temperature rises have been even more dramatic.

November mean surface air temperatures over land and ocean every decade since 1880. Data source: NASA GISTEMP. (Roger Warburton/ecoRI News)
In fact, the rise in November temperatures since 2015 is in line with a particularly disturbing trend: The latest data show that, since 2015, the warming trend is accelerating. The figure below shows the seriousness of the problem.

Global air temperatures over land and ocean. The yearly mean, blue, and the 5-year mean, red, have risen significantly above the gray trend line. Data source: NASA GISTEMP. (Roger Warburton/ecoRI News)
The gray line represents the steadily rising global temperature that was reasonably steady between 1970 and 2015. Since then, the temperature rise has accelerated. This is shown in the figure by the blue and red curves rising significantly above the gray trend line.
The gray trend line has often been used to predict long-term impacts of the future temperature rise. If the acceleration continues, many of the current estimates of the impacts of global warming will be seen as severely underestimated.
Roger Warburton, Ph.D., is a Newport resident. He can be reached at rdh.warburton@gmail.com.
References: GISTEMP Team, 2020: GISS Surface Temperature Analysis (GISTEMP), version 4. NASA Goddard Institute for Space Studies. Dataset accessed 20YY-MM-DD at https://data.giss.nasa.gov/gistemp/. Lenssen, N., G. Schmidt, J. Hansen, M. Menne, A. Persin, R. Ruedy, and D. Zyss, 2019: Improvements in the GISTEMP uncertainty model. J. Geophys. Res. Atmos., 124, no. 12, 6307-6326, doi:10.1029/2018JD029522.
Roger Warburton: Ocean damage increases in CO2 buildup as climate warms

January sea surface temperatures off southern New England have risen significantly since 1980.
— Roger Warburton/ecoRI News
From ecoRI News (ecori.org)
Living in Rhode Island, we are aware how the ocean rules our weather. What is less well known is that climate change is fundamentally altering the waters off our coast.
The image above shows how the January temperature of the ocean off New England has changed since 1980. For example, vast areas of dark blue — representing temperatures around 41-43 degrees Fahrenheit — have shrunk and are now a lighter blue, representing temperatures around 43-45 degrees.
The effects of a temperature rise in the ocean are significantly different from a temperature rise over land. We experience this difference when we walk across a sandy beach on a hot day. Exposed to the same sunlight, the sand burns our feet while the ocean warms gradually to the perfect temperature for a summer swim.
Rhode Island’s climate is moderated because the ocean takes longer than the land to heat up over the summer and longer to cool down during the fall.
The global impact of this effect is shown in the image below, which shows that, over recent decades, the continents have warmed much more rapidly than the oceans. The Earth’s land areas were 1.4 degrees Celsius (2.5 degrees Fahrenheit) warmer than the 20th-Century average, while the oceans were 0.8 degrees Celsius (1.4 degrees Fahrenheit) warmer.
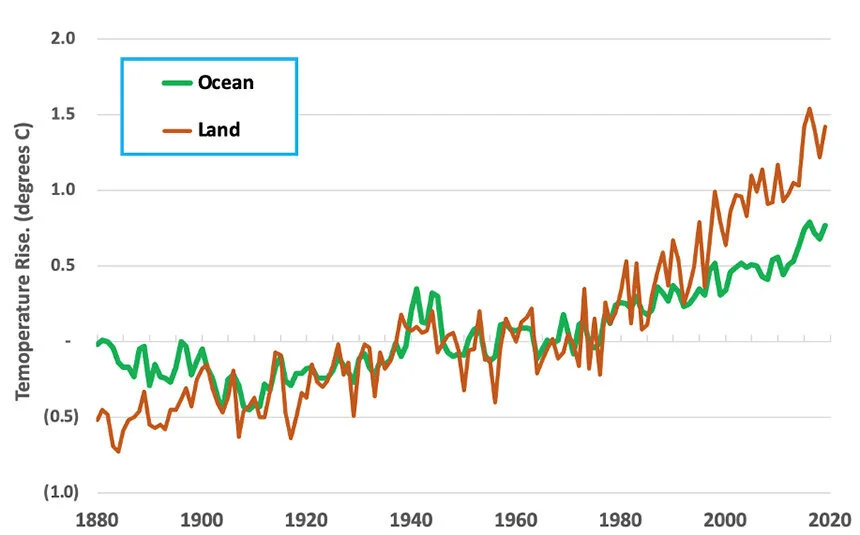
Since 1880, the Earth’s land temperature has risen faster than the ocean temperature. “
— Roger Warburton/ecoRI News
Unfortunately, the ocean’s smaller temperature rise isn’t good news, because the oceans can store more than four times as much heat as the land.
Even though ocean temperatures have risen less than the land’s, it’s becoming clear that the impacts of climate change depend on a complex interaction between dry land and the warming ocean.
Ships and buoys have been recording sea surface temperatures for more than a century. International cooperation and sharing of data between nations has created a global database of sea surface temperatures going back to the middle of the 19th century.
In addition, modern satellites remotely measure many ocean characteristics over the entire extent of the Earth’s oceans. The data are now so accurate that it’s possible to detect the small temperature rise from ships’ propellers as they traverse the oceans.
The warming of both the land and the oceans is caused by rising levels of atmospheric carbon dioxide. When CO2 dissolves in the ocean, it forms carbonic acid, which in turn, breaks into hydrogen and bicarbonate ions. Clams, mussels, crabs, corals and other sea life rely on those carbonate ions to grow their shells.
In 2015, Mark Gibson, deputy chief of marine fisheries at the Rhode Island Department of Environmental Management, noted that ocean acidification is a “significant threat” to local fisheries.
In fact, a study published in 2015 found that the Ocean State’s shellfish populations are among the most vulnerable in the United States to the impacts of acidification.
In polar regions such as Alaska, the ocean water is relatively cold and can take up more CO2 than warmer tropical waters. As a result, polar waters are generally acidifying faster than those in other latitudes.
The water in warmer regions can’t hold as much CO2 and are releasing it into the atmosphere. Therefore, the acidification from carbon dioxide is damaging the oceans in both polar and equatorial regions.
Warming oceans are also changing the winds that whip up the ocean, resulting in upwells from deep waters that are nutrient-rich but also more acidic.
Normally, this infusion of nutrient-rich, cool, and acidic waters into the upper layers is beneficial to coastal ecosystems. But in regions with acidifying waters, the infusion of cooler deep waters amplifies the existing acidification.
In the tropics, rising temperatures are slowing down winds and reducing the exchange of carbon between deep waters and surface waters. As a result, tropical waters are becoming increasingly stratified and more saturated with carbon dioxide. Lower layers then have less oxygen, a process known as deoxygenation.
Warming ocean temperatures have also caused a rapid increase of toxic algal blooms. Toxic algae produce domoic acid, a dangerous neurotoxin, that builds up in the bodies of shellfish and poses a risk to human health.
In coastal areas, such as Rhode Island, temperature changes can favor one organism over another, causing populations of one species of bacteria, algae, or fish to thrive and others to decline.
The sum of all these impacts is damaging to the Rhode Island economy. The state’s shellfish populations are already among the most vulnerable in the United States to the impacts of a warmer ocean.
Roger Warburton, Ph.D., is an ecoRI News contributor and a Newport resident. He can be reached at rdh.warburton@gmail.com.
Figure 1 was generated using data from the Copernicus Climate Change and Atmosphere Monitoring Services (2020). The ERA5 dataset is produced by the European Space Agency SST Climate Change Initiative based on global daily sea surface temperature data from the Group for High Resolution Sea Surface Temperature and made available by the Copernicus Climate Data Store.
Figure 2 was generated using data from NOAA’s National Centers for Environmental information, Climate at a Glance: Global Time Series.

Roger Warburton: What lobsters tell us about climate change
If present trends continue, by the end of the century, the cost of global warming could be as high as $1 billion annually for Providence County, R.I., alone, according to data from a 2017 research paper. That’s about $1,600 per person per year. Every year.
But, before we talk about the future, let’s discuss the economic damage that has already occurred in Rhode Island because of warming temperatures.
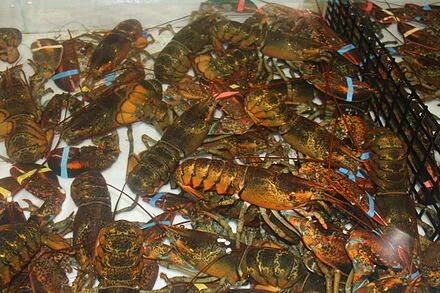
Like rich Bostonians, Rhode Island’s lobsters have moved to Maine. In 2018, Maine landed 121 million pounds of lobsters, valued at more than $491 million, and up 11 million pounds from 2017. It wasn’t always so.
Andrew Pershing, an oceanographer with the Gulf of Maine Research Institute, has noted that lobsters have migrated north as climate change warms the ocean. In Rhode Island, for instance, days when the water temperature of Narragansett Bay is 80 degrees or higher are becoming more common. From 1960 to 2015, the bay’s mean surface water temperatures rose by about 3 degrees Fahrenheit, according to research data.
A 2018 research paper Pershing co-authored said ocean temperatures have risen to levels that are favorable for lobsters off northern New England and Canada but inhospitable for them in southern New England. The research found that warming waters, ecosystem changes, and differences in conservation efforts led to the simultaneous collapse of the lobster fishery in southern New England and record-breaking landings in the Gulf of Maine.
He told Science News last year that with rocky bottoms, kelp and other things that lobsters love, climate change has turned the Gulf of Maine into a “paradise for lobsters.”
However, in the formerly strong lobster fishing grounds of Rhode Island, the situation is grim. South of Cape Cod, the lobster catch fell from a peak of about 22 million pounds in 1997 to about 3.3 million pounds in 2013, according to the 2018 paper published in Proceedings of the National Academy of Sciences.
Lobsters provide interesting lessons on the impact of the climate crisis.
A conservation program called V-notching helped protect Maine’s lobster population. “Starting a similar conservation program earlier in southern New England would have helped insulate them from the hot water they’ve experienced over the last couple of decades,” Malin Pinsky, a marine scientist with Rutgers University, told Boston.com two years ago.
Rhode Island’s lack of conservation efforts in the face of the growing climate crisis contributed to the collapse of its lobster fishery. Doing nothing or too little in the face of a changing climate can be economically devastating.
Another existing, and growing, threat to the economic health of Rhode Island comes from Lyme disease, which has increased by more than 300 percent across the Northeast since 2001. A changing climate is a big reason why. There is a growing body of evidence showing that climate change may affect the incidence and prevalence of certain vector-borne diseases such as Lyme disease, malaria, dengue, and West Nile fever, according to a 2018 study.
Chronic Lyme disease is more widespread and more serious than generally realized. There are some 20,000 cases annually in the Northeast and each averages about $4,400 in medical costs. Most Lyme disease patients who are diagnosed and treated early can fully recover. But, an estimated 10 percent to 20 percent suffer from chronically persistent and disabling symptoms. The number of such chronic cases may approach 30,000 to 60,000 annually, according to a 2018 white paper.
As the lobsters and the ticks vividly demonstrate, prevention is cheaper than cure. The longer we wait, the more painful, and expensive, the consequences will be.
The aforementioned 2017 study Estimating Economic Damage from Climate Change in the United States by world-renown economists and climate scientists projects the impact of climate change for every county in the United States. The results for Rhode Island and its neighbors are summarized in the map to the right, which depicts the estimated economic damage, in millions of dollars annually for each county in Rhode Island, Massachusetts, and Connecticut.
The data make clear that the economic damage will not be uniformly distributed. Some counties, such as Providence County, will be hit much harder than others. It also may seem that the southern counties will suffer much less. But that isn’t quite true, as graph below shows. The damage per person per year is projected to be substantial.
The total economic damage to Rhode Island, by 2080, could result in a 2 percent decline in gross domestic product (GDP). To put that in context, during the Great Recession of 2008-2010, there was only one year of GDP decline: minus 2.5 percent in 2009. By 2010, GDP had bounced back to positive growth, at 2.6 percent.
Therefore, the impact of a 2 percent hit to Rhode Island’s GDP from the climate crisis could look like the recession of 2009, only becoming permanent, continuing year after year. Also, it won’t all happen in 2080, the damage will continually get worse.
The economic damage is projected to come from more frequent and intense storms; sea-level rise; increased rainfall resulting in more flooding; higher temperatures, especially in the summer; drought that leads to lower crop yields; increased crime.
In addition, essential infrastructure will be impacted, including water supplies and water treatment facilities. Ecosystems, such as forests, rivers, lakes and wetlands, will also suffer, and that will impact human quality of life.
In the coming two weeks, we will describe how each Rhode Island county faces different levels of the above threats. As a result, each county needs to develop appropriate mitigation strategies.
The damages from the climate crisis will place major strains on public-sector budgets. However, much of the economic damage will be felt by individuals and families through poorer health, rising energy costs, increased health-care premiums, and decreased job security.
As always, prevention is cheaper, and more effective, than cure. Inaction on climate change will be the most expensive policy option.
The lobsters should teach us a valuable lesson: conservation measures based on sound scientific and economic principles could have helped mitigate losses caused by the climate crisis.
Roger Warburton, Ph.D., is a Newport ,R.I., resident. He can be reached at rdh.warburton@gmail.com.